Category Archives: 2022 Mitchell AAUS

Phoebe Churney

Summer in Maine

Maine is known as “Vacationland” and our coastline, mountains, and forests draw millions of tourists every summer. Mainer’s have come to dread the stream of traffic that begins to arrive in late May and departs soon after Labor Day. I’ve grown up with the same mindset dreading the endless traffic as I also try to enjoy my home state. However, this summer my perspective changed as I lived with more than 20 interns at Bigelow Laboratory for Ocean Sciences, many of whom do not have the joy of spending their summers in Maine. I was excited to share the beautiful state of Maine as other Bigelow interns also got to experience many Maine “firsts” of their own. I found myself many times this summer feeling like a tourist myself as I explored the coast with my peers or as I travelled to new places in Maine.

Summer 2022 interns staying at the Bigelow Residences, visiting on the famous trolls at the Coastal Maine Botanical Gardens (CMBG) hosted by the CMBG interns!

This summer I have seen many incredible sights that my state has to offer for the first time. I saw my first moose and puffin! Early morning drives up north are notorious for moose. I saw the puffins  on a dive say in between fish surveys, when we were in transect from Metinic to Allen Island! Most recently, I saw my first Mola Mola (five in one day!) and swam with it too! They are the heaviest bony fish and bask in the warm surface waters in the Gulf of Maine (GoM) during the summer. I also saw my first Luna moth and first Boothbay sunrise with some interns!

Moose sighting in Baxter State Park!

A subpar photo of the Atlantic Puffin, sadly these seabirds are listed as “Vulnerable” on the IUCN Red List.

An amazing experience being able to swim with this gigantic fish!

The curious gaze of the Mola Mola

This Luna moth is male (as seen by his fluffy antennae), and they are one of the largest moth species in North America, only living for a few weeks post-metamorphosis.

A group of determined interns to watch the sunrise at least once during the summer. It was worth it to wake up at 4:30, especially when a favorite local bakery opens at 7 am.

I traveled farther north, east, and “up” in the state of Maine than I had ever done before. The most east being a dive site on the coast of Ram Island, off Machiasport. Shout out to the Downeast Institute for allowing Rasher Lab to stay at their dormitory while we were surveying our northern rocky reef sites. While this east in Maine, I saw and dove in my first true GoM kelp forest! I have also completed 100 dives in my drysuit since May of 2021 🙂 While I was the most north, I have been in Maine, I hiked Katahdin and therefore was also at the highest elevation in the state.

Laminaria digitata at Crumple Island

Kelp forest also at Crumple Island

My brother, Parker, and I, 1/4 of the way through the hike!

Knife Edge Trail Mount Katahdin

Halfway point at the peak of Katahdin!

Descent from the peak! The loop (Helon Taylor to Knife Edge to Saddle to Chimney Pond) we hiked was about 10 miles and we completed it in 9.5 hours!

I had the opportunity to participate in Bigelow Laboratories annual summer open house! I also helped set up for the event by decorating the whiteboard as a backdrop for a photobooth during open house with other Bigelow interns. I helped some staff make paper microscopes – Foldscope’s – for another open house activity. At the event, I volunteered at the “Discovering Density” station where I demonstrated and taught visitors the public how density works when freshwater and saltwater meet.

Drawings depicting interns research and critters found in Maine!

Attempting to look through the one of three Foldscopes I made!

Discussing density in terms of oil and water with a fellow intern

I also had the opportunity to meet up and eat lunch with Heather Albright of AAUS and Chris Rigaud (DSO of University of Maine), sadly we did not get a picture. Additionally, a couple local interns also from Maine Maritime met up with Professor Whitney (Summer researcher at Bigelow), Aubrey Mitchell (MMA student and Bigelow Intern), and me for some ice cream in downtown Boothbay Harbor.

Self-timer selfie post-ice cream!

One of the most exciting events I attended this summer was the first Rasher Lab Olympics. Dara, Shane, and Aubrey (graduate student in the lab) put together a nine-part series of team challenges influenced by lab activities that both the lobster and eDNA lab complete daily. I was “randomly” chosen to be on Dr. Rasher’s team where he, Dara, Shane, Caroline, Riley, and I competed against the rest of the lab and ended up victorious at the last event! Luckily, my unknown secret talent of folding origami boats came in handy as Doug sailed our ship with his lung capacity to victory!

“Lobster larvae” bobbing activity based on the Lobster Lab’s water changes

2022 Rasher Lab Olympic winners! Go Team Doug!

I cannot believe I have reached the end of my internship. It has been amazing to experience a summer full of research, diving, and exploring in Maine! I would like to thank AAUS and OWUSS for this incredible summer adventure as well as my host Doug Rasher and his lab (Dara, Shane, Rene, and Stuart) for their help and eagerness to teach me about Gulf of Maine kelp forests. I look forward to presenting my summer experience as the 2022 AAUS Mitchell Scientific Diving Research Intern at the 2023 annual meeting.

Share

PCR, Gels, and Qubit®, oh my!

As mentioned in my prior blog, the month of June was busy with diving as we completed our spring survey at 10 dive sites. A break from intensive field sampling presented the opportunity to do molecular work in the lab! I was excited to dive into preparing environmental DNA (eDNA) samples for sequencing after spending several weeks collecting and filtering water destined for eDNA analysis. To reiterate, the Rasher Lab’s project in the larger Maine-eDNA program is focused on studying “Species on the Move” within kelp forest ecosystems across the Gulf of Maine (GoM). This study pairs traditional ecological surveys with collections of eDNA water samples, during our dive surveys. Combining the two approaches will help us gain a better understanding of our rapidly changing kelp forests in the GoM, because eDNA may reveal the presence of newly arriving species in the ecosystem that are currently too rare to detect through visual counts.

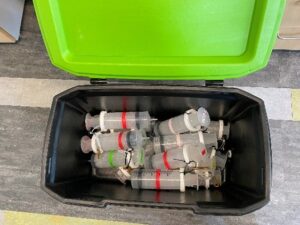
In our study, eDNA sampling consists of collecting six liters underwater at the dive site as well as three liters of water 1 meter below the surface. We take the water back to the lab and filter it immediately; the filter is then frozen for DNA extraction. This sample has a mixture of DNA from many organisms found in the environment, from bacteria and algae to the rarer fragments of DNA from fish, marine mammals, or sharks that may have swum through the area. Therefore, these samples contain a lot of information about the ecosystem – but finding the information you want requires a lot of lab work to ask the questions. I am going to discuss three different kinds of molecular work that we use to answer eDNA-related questions.

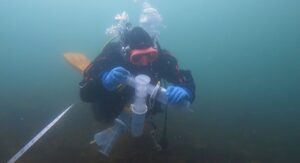
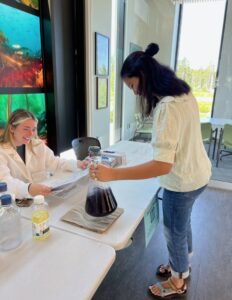
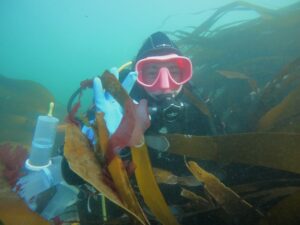
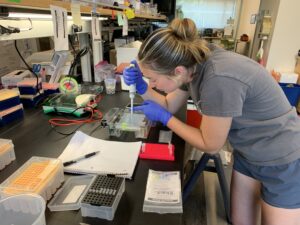
Me collecting water along the transect for eDNA analysis

Using eDNA to measure fish diversity

One goal of the study is to ask what fish species live in the rocky reef ecosystems along the coast of Maine. For example, how do fish communities in the GoM differ between those found in colder, northerly kelp forests vs. those found on warmer, southerly reefs? We start to answer this question by completing visual fish surveys, where we swim along transects and record the fish we have encountered. But if you have ever experienced a fish survey, you may realize it could take hundreds of hours underwater to see all the fish species. Now picture trying to do these fish surveys in a cold-water ecosystem with poor visibility, where few people have completed fish censuses before, and you’ll quickly realize that the fish surveys do not do justice to the fish diversity found in that ecosystem. So, we can ask our eDNA samples what fish are present by sequencing the fragments of fish DNA found in the water sample. To prepare the eDNA samples for sequencing, we use a process that includes PCR, PCR clean-up, gel electrophoresis, and Qubit®. The purpose of these steps is to amplify and isolate the fish DNA fragments from the eDNA sample prior to sending our samples to a company that conducts DNA metabarcoding, which will provide us with information of what species of fish are present in the environment.

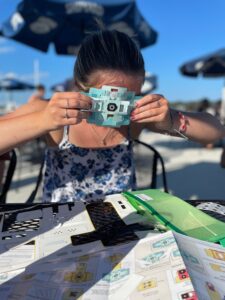
Dara Yiu completing a juvenile fish swath survey at Metinic Island, midcoast Maine

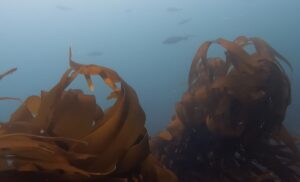
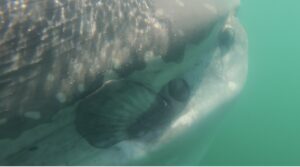
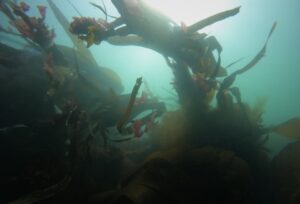
An example of poor visibility: a school of Pollock at Metinic Island seen only four meters away

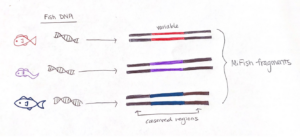
To effectively sequence the fish DNA, we need to choose a genetic “barcode”, which is a DNA marker where the associated gene sequence is unique for each species. A good barcode has two conserved regions that “sandwich” a variable section. The conserved regions are shared among all fishes, but not bivalves or crustaceans, and the variable region contains information to identify fish species. The sequence we target is called the “MiFish” fragment, and it fits the criteria extraordinarily well such that it has been used to assess fish diversity around the world.

We start preparing our sample for analysis by setting up a chemical reaction that easily finds the fish DNA fragments and makes thousands of copies. This process is called a Polymerase Chain Reaction (PCR), which is the molecular tool we use to amplify the fish fragments in our eDNA sample. PCR has three main steps: denaturing, annealing, and extension. But prior to starting those steps, we use a MiFish gene primer set to maximize the detection of fish DNA fragments. Essentially, this primer set detects the conserved region of the MiFish sequence in the eDNA sample and “latches on” to the respective section of fish DNA. In the end, it is easier to sequence and differentiate thousands of copies of the fish DNA, so amplification is an important step in measuring fish diversity from eDNA.

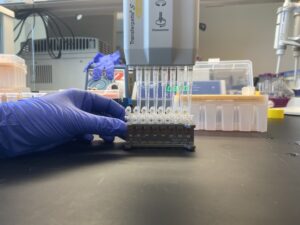
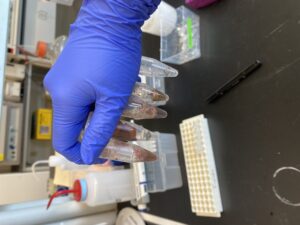
To set up this PCR reaction, first, I make a “Master Mix” which contains the following ingredients: primers that bind to the “conserved” sections of the barcode region, free nucleotides which are building blocks of DNA, and Taq polymerase – the enzyme that puts the blocks together and makes the new DNA strand. The amount of Master Mix created for each PCR is dependent on the number of samples that will be processed, and luckily a pre-programmed Excel sheet calculates the numbers! The Master Mix is then aliquoted into PCR tube strips and the eDNA sample is added too! All the PCR samples are then transferred to a thermocycler aka “Larry”.

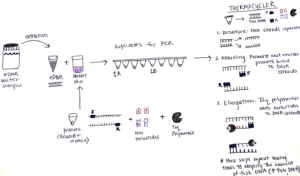
The thermocycler is programmed with an optimized temperature cycle for the replication of our fish DNA. First, the samples are heated which causes the DNA strands to separate. Next, the samples are cooled in an annealing process which allows the primers to bind to the DNA strands. Lastly, Taq polymerase extends new DNA strands by adding the free nucleotides (building blocks) after the primer sites, making copies of the MiFish fragments. These three steps are repeated many times which results in amplification of the fish DNA. So, the small amount of fish DNA that was in the original sample ends up being a much larger amount after PCR.

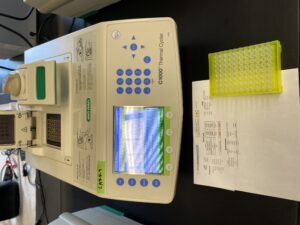
“Larry” the thermocycler

Once our samples come out of the thermocycler, the PCR is complete, and we must run a gel electrophoresis. Electrophoresis uses electrical charges to separate DNA fragments of different lengths. Because DNA is negatively charged, the positive charge on the bottom of the rig pulls the DNA towards it, and over time the smaller DNA fragments travel faster and farther through the gel. This results in the band formation of DNA in the gel. The purpose of gel electrophoresis is to visually determine if the sample contains fish DNA. I combine a small portion of DNA with a loading dye. This is repeated for all the samples. The first and last wells of the gel are loaded with a DNA ladder which provides a reference for DNA fragment sizes. Once everything is loaded into the wells, I attach the lid and turn on the machine which sends electrical charges through the gel.

Loading a gel!

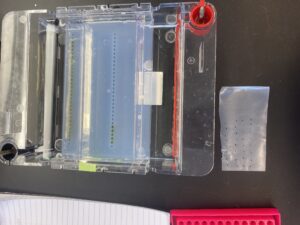
What a gel looks like as it is being loaded!

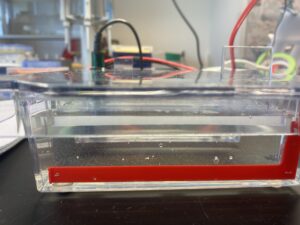
The bubbles in the gel rig form when the gel is running!

After the gel is run, the bands created during this process need to be dyed again and we use a DNA stain called SYBR gold. The gel is placed in a Tupperware container in the dark as SYBR is light-sensitive, for an hour to “soak in” the dye for UV visualization.
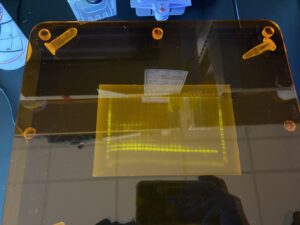
Bands from the gel!

As you can see, there are multiple bands present on the gel, but consistently the bottom bands represent our fish DNA. We want our final sequenced samples to be as “clean” as possible, so the remaining fish DNA post-PCR is given to Dara Yiu, a PhD student leading this part of the project. She completes a clean-up process which aims to remove excess fragments that may have also been amplified by the MiFish primers. This is because the MiFish primer can also attach to some bacteria that may share similar DNA segments to fish. We run one more gel, and then the samples are almost ready to be sent for sequencing!
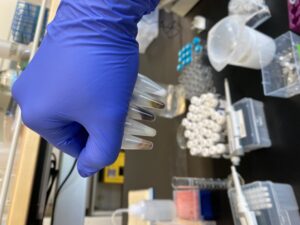
Clean-up process!

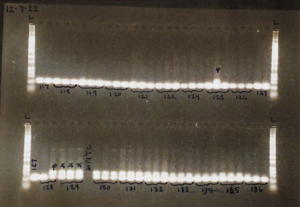
Example of a finalized gel!

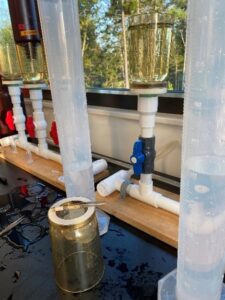
The last step before sending in the fish DNA for sequencing is to place them in a Qubit®. The Qubit® quantifies the amount (concentration [ng/uL]) of DNA in the whole sample based on a fluorescence emission. For example, the fluorescent dyes will emit a signal to the machine if it has bound to the target molecule, which in our case, is the DNA found in the sample. Because the Qubit® reads the DNA concentration of the whole sample, not just the fish DNA, the clean-up process is an important step.
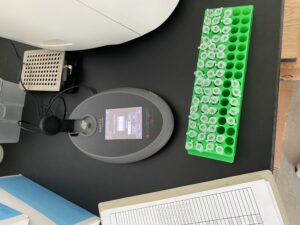
Qubit® and samples

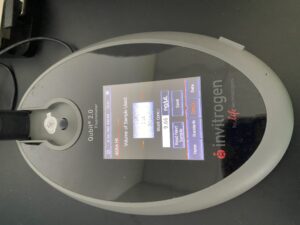
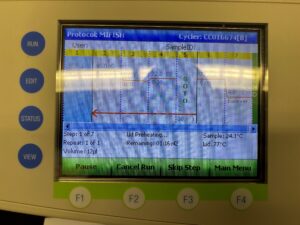
Close-up of Qubit® screen

Now the DNA samples are ready to be sequenced! We send them to a facility for DNA metabarcoding, which means the samples will be put into a sequencing machine that will read each DNA fragment. We will then match our sequences to a reference library (i.e., a database that contains the unique genetic signatures of each species that may be present in the GoM) to identify the fish species found at the rocky reefs where we collected our eDNA water samples.

Using eDNA to detect and quantify invasive species

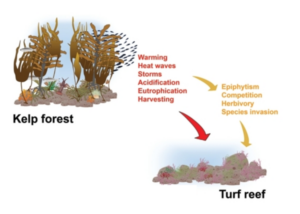
After concluding fish molecular work with Dara, I learned two other variations of PCR: quantitative (qPCR) and droplet digital (ddPCR). These methods are typically used to identify a single species found in an eDNA sample and quantify the number of gene copes that are related to that species. Shane uses these methods to detect the presence of Dasysiphonia japonica (DJ), which is an invasive filamentous turf-forming red algae found in the southern Gulf of Maine, where kelp forests have largely collapsed in recent time.

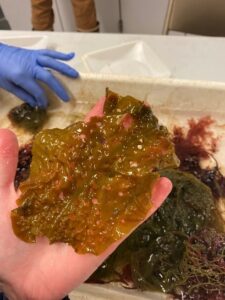
When DJ is well established in an ecosystem, it is easy to see. It creates a fluffy red carpet on the bottom, where it may outcompete other native algae species, like kelp, for space. As the GoM gets warmer, DJ appears to be rapidly moving north up the coast. DJ can spread quickly because it can reproduce when it branches fragment or when its spores are transported in the water column to a new location. By subjecting the eDNA samples to qPCR/ddPCR we can measure the precise amount of DJ DNA in our eDNA samples, to verify its presence and infer how much DJ is present in the environment. Due to the sensitivity of these methods, we may be able to detect the presence of DJ on these reefs before we see it on our SCUBA surveys.

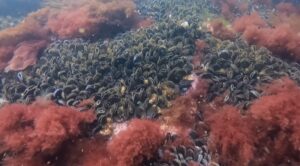
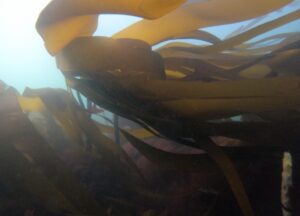
One example of kelp loss in a southern Maine rocky reef ecosystem and as a result DJ turfs form carpets

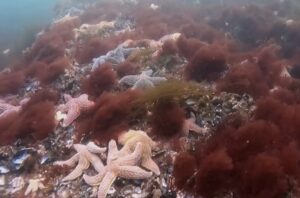
Another example of examples of DJ turf formation

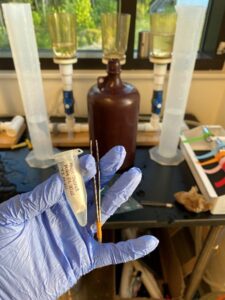
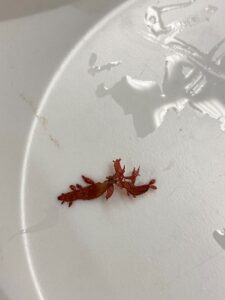
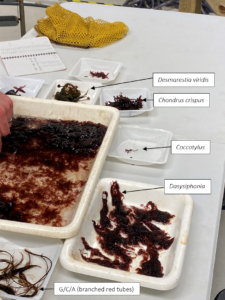
qPCR is a similar PCR process that replicates a targeted sequence of DNA; however, it is special because when the target sequence is present, it gives off fluorescence as the reaction amplifies the DNA. By measuring the fluorescence and relating it back to standards of known gene copies we can calculate how many strands of DNA were in the original sample. qPCR assays need to be designed so only the target species is amplified thus giving off fluorescence. In our case, I had to confirm that the qPCR would only amplify DJ DNA and not accidentally amplify other common red algae species found at our GoM rocky reef sites. To test this, I first extracted the DNA from four red algae: Polysiphonia, Euthora, Palmaria, and an unknown red tube alga. Next, we ran a qPCR with those samples using the DJ assay. Luckily, none of these species amplified during qPCR, so we have a good molecular tool to measure DJ DNA.

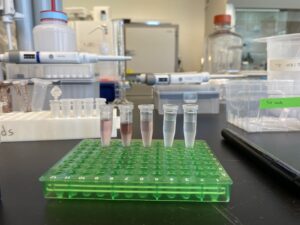
Crushed up algae for DNA extraction!

Once we confirmed the specificity of the qPCR assay to only target DJ, we will be able to use it as a tool to determine how much is present in the water at different rocky reef sites.

After I learned how to use qPCR, I was presented with the opportunity to learn droplet digital PCR (ddPCR); which is like qPCR in that they both target single species, but ddPCR is newer and has a higher sensitivity – in other words, it can detect lower quantities – therefore greater capabilities of tracing rare species occurrences. Because of the high sensitivity, ddPCR is most used in the medical field, for example with cancer research. ddPCR gets its name “droplet” because there are 20,000 nano droplets in each tube, so rather one tube containing a single reaction, each tube contains 20,000 nano reactions. This is what contributes to its higher sensitivity. These droplets will fluoresce (positive) when the target species DNA is present or will not fluoresce (negative) when the target is absent. These droplets represent how many copies of the target are present in a sample. With our goal of detecting potentially rare invasive species and their range shifts across the coast of Maine, we decided to use ddPCR because of its higher sensitivity over qPCR.

To effectively use ddPCR, Shane Farrell (a PhD student leading this part of the project) and I have been running a series of tests to determine analytically validate the precise sensitivity of the DJ assay. First, we needed to optimize the temperature the reaction is run at; this meant exposing the same sample to a temperature gradient in a thermocycler. This test produced a series of separations between positive and negative droplets. The temperature that produced the most separation between positive and negative droplets, with the least amount of “noise”, is the optimal temperature to run the ddPCR for the future assays. However, if the temperature is too low, the assay would not be as specific, so we chose 59.5 C as opposed to 57 C. The additional 2.5 C adds to the specificity of the assay. We also completed two other tests to understand the false positivity rate of our assay and determined the lowest amount of DNA we can accurately quantify in a sample.

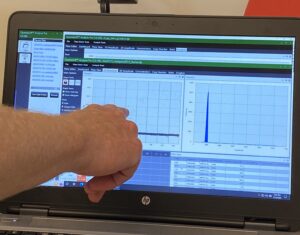
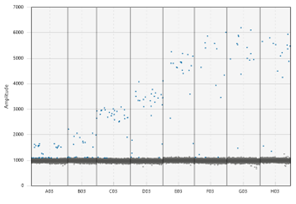
The dots on the upper portion of the graph represent positive droplets, whereas the line of dots on along the bottom are negative. We chose the temperature being pointed to, as there were the least number of dots in-between + and –

After completing these tests that help us understand the limitations of our ddPCR assay, we will run 110 eDNA samples with the ddPCR to find out how much DJ is present at our study sites distributed across the GoM. We already know that DJ is abundant in the southern waters, but it is important to document the spread up the coast to the cold northern waters, where kelp is currently still abundant. Afterall, the Rasher lab is focused on “Species on the Move”. We will also be using ddPCR to track two other species whose ranges are shifting: Membranipora membranacea (lacy bryozoan) and Centropristis striata (black sea bass). Developing a solid understanding of ddPCR as a molecular tool will be beneficial to recognize the range shifts of species as they react to warming in the GoM.

I am super thankful for the numerous opportunities I have had to conduct molecular work with Dara and Shane. It is truly a unique experience to be part of projects in the upcoming world of eDNA, especially on work being completed in my home state. As the end of my internship approaches, I am excited to be part of the summer sampling season at the 10 dive sites as well as finishing the remaining fish surveys!

Share

Sorry Dolly, 9 to 5 is Boring

My journey as the 2022 American Academy of Underwater Sciences (AAUS) Mitchell Scientific Diving Intern for the Our World Underwater Scholarship Society (OWUSS) began May 16th as I ventured to East Boothbay, Maine. This summer, I am working at Bigelow Laboratory for Ocean Studies in Dr. Doug Rasher’s Lab where I am assisting Dr. Rasher as well as PhD students Rene Francolini, Dara Yiu and Shane Farrell (2018 Dr. Lee H. Somers AAUS Intern) with a project entitled “Maine-eDNA”. This 5-year project, funded by the National Science Foundation,  involves multiple Maine institutions, and aims to improve our understanding of Maine’s coastal ecosystems using molecular ecological tools. As someone who was born and raised in Maine, I was wicked excited to find out I would be participating in such a crucial project, especially one involving the ever-advancing world of eDNA.

For those who do not know, eDNA stands for environmental DNA and this is a relatively new and upcoming molecular tool in ocean sciences and stands to transform how we monitor and understand global ocean ecosystems. An easy way I learned to understand eDNA, is for instance: if you have any furry or hairy pet, you always end up covered in their hair all the time. Anything that “sheds” off your body will have DNA – your entire genetic code. If you take a sample of dust from your floor, you will certainly find lots of DNA belonging to your furry animal, and plenty of human DNA as well. Of course, you don’t need DNA to know about you and your pets, but you may also find a small amount of DNA belonging to insects or rodents – which would show evidence of critters you may not see often but are secretly living in your house. In any body of water, the same process happens. For example, marine animals such as fish shed scales, mucus, or cells into their environment. So, analyzing eDNA – which is, in this instance, all of the DNA collected from a water sample – can be a powerful “forensics” tool to assess who lives in that habitat. Using eDNA is important because it allows scientists to collect information about the total biodiversity in the ecosystem by metabarcoding all the species (fish, algae, invertebrates, microbes etc.) at a location, as well as tell us about organisms that are too rare, small, or hidden to see with our own eyes.

Image by Liam Whitmore, University of Limerick, CC BY-ND (https://theconversation.com/environmental-dna-how-a-tool-used-to-detect-endangered-wildlife-ended-up-helping-fight-the-covid-19-pandemic-158286). Visual explanation demonstrating the flow of eDNA metabarcoding, which starts with the species from an environmental sample to DNA extraction, and results in a “barcode” for the species found in the sample.

The Rasher lab’s project in the larger Maine-eDNA program, is focused on studying “Species on the Move” within kelp forest (rocky reef) ecosystems across the Gulf of Maine (GoM). Our goals are to track changes in species distribution (i.e. the loss of native species and the arrival of new species to the ecosystem), to study the ecological impacts of changing reef communities, and to develop models that help predict these species geographic range shifts. Now you may be wondering, why are the species moving? As a Mainer, I have grown up seeing the impacts of warming in the GoM, but what many people do not know is that the GoM is warming faster than 96.2% of the world’s oceans (GMRI 2021). Additionally, the Gulf of Maine Research Institute (GMRI) recorded the longest marine heat wave ever last year(2021), which lasted from April through most of August. Long story short, species are on the move in the GoM because of ocean warming and marine heat waves, which directly reduces the survival of kelp (a group of cold-water species that create forests) as well as cause the formation of red algae “turf reefs”.  Kelp and red algae are quite different – the loss of big, complex structures created by kelp may potentially lead to other changes in the flora and fauna on the rocky reefs across the coast. The transformation of kelp forests to reefs dominated by red algae may have consequences for important commercial species, as their larval and juvenile stages depend on kelp forests as refuge from predators.

Modified image from Filbee-Dexter and Wernberg in their article, “Rise of Turfs: A New Battlefront for Globally Declining Kelp Forests”. This depicts the direct (red) and indirect (yellow) drivers of a transition from kelp forest to turf reef (Filbee-Dexter and Wernberg 2018).

How are we collecting data to meet the goals of “Species on the Move” project? Through traditional ecological surveys and experiments in conjunction with eDNA analysis. That is where I come in and I get to be in the field collecting data and participating in lab work. As the title of this blog posts suggests, this summer (and science in general) does not involve an everyday 9 to 5 schedule. Instead, our field days are sometimes from 8 am to 11 pm! Each field day consists of going to one of ten study sites. We try our best to pre-pack the boat with gear, otherwise it is packed the morning of, and we try to leave the dock around 9 am.

Pictured above (left) is the Bigelow vessel stern and in the opening of the trees on land is Bigelow Laboratory!

Pictured above (right) includes the PVC frames for squid pops which I’ll talk about below.

On the way to the dive site, we attach line with buoys to PVC frames, because upon arrival to the site all six frames are deployed overboard in a straight line, spaced 10 m apart. Each frame consists of four “squid pops” which are circular cut outs of dried squid. There are two on the top frame to entice fish to get an estimate of predation intensity and two on the bottom frame for invertebrate (e.g., crab, lobster) predation intensity, which we will later compare between sites that have healthy kelp forests to those where kelp has disappeared. Once all the frames are out, we anchor the boat at the GPS location for the dive site and get ready for the dives. Below is a written dive plan that does a great job at explaining what is required at every dive site. I will do my best to explain each dive 🙂

The first dive includes roving fish surveys, eDNA collection (using the syringes pictured above), and juvenile fish and microhabitat swath surveys. Basically, we take two 50 m transects and swim 100 m total, while collecting roving fish data. I also collect four syringes (totaling 2L) at two locations along the first transect and repeat the same process on the second transect. Then on the way back to the starting point, I assist Dara with juvenile fish swaths by spotting tiny fish for 15 m increments along the transect. All the above is repeated on the third and last for the last 50 m transect.

Me and my eDNA syringes in a kelp forest in northern Maine.

The second dive includes conducting eight quadrat surveys along a 50 m transect. Each quadrat survey includes assessment of percent cover of kelp and other algae found within the 1 m2 PVC frame, stipe counts of brown algae, counts of fish, as well as counts and percent cover of invertebrates (e.g., sponges, barnacles, etc.). In addition, within some of these replicate quadrats we collect metabolomic water samples and collections of microbial communities as part of Shane’s effort to understand how the loss of kelp forests impacts the chemical and microbial microenvironments of the reef. After Shane and Dara take estimates of algae cover, count animals, and collect water, I am responsible for harvesting and collecting all the algae within six quadrats, so that we can calculate an estimate of biomass. This involves collecting all kelp found in the full 1 m2 quadrat as well as collecting all other algae in a 0.25 m2 area of quadrat by hand. By collecting the kelps and algae’s it allows us to get precise measurements of the relative abundances of kelp and red algae species – and ID all the cryptic red algae species – which is important for tracking “species on the move” and for eDNA comparison. Some algae species must be viewed under a microscope in the lab or sent off to a facility to be genetically barcoded, to reveal their identity.

The last dive is used to finish the last quadrat survey, but most likely to collect any leftover gear or more algae.

Left to Right: Me, Dara, and Shane before we entered the water for our third dive of the day!

After the dives, we collect the squid pop frames and head back to Bigelow, but the fun for the day does not end there. Once we get back to the lab, take everything off the boat, and clean/rinse gear, lab work starts! First, all the eDNA water samples are put through a filter and all the DNA from the water sample is then stuck to a piece of filter paper, which we save for analysis later.

Seawater from eDNA syringe in graduated cylinder is poured into the filter seen in background.

Filter paper with DNA from filtered seawater collected from Allen Island.

The last activity of a dive day is sorting, IDing, and weighing all the different algae collected from the quadrats! I took a phycology class my sophomore year of college, but I missed out on the lab portion due to COVID. So, this has been a great experience to apply what knowledge I have and of course learn more about algae! I have become familiar with many of the brown algae like Agarum and Laminaria, green algae like Chaetomorpha and Ulva sp, and red blade algae like Chondrus, Porphyra, Lomentaria, Palmaria, and Euthora. These species I have become very familiar with and I am able to identify them underwater too!

Agarum! Known for its holes which is believed to be an adaptation for fast moving water environments.

Lomentaria! Looks like a cactus 🙂

The filamentous branched and branched red tubes are more difficult to ID by just looking at them, so we usually examine them under the microscope. Dara has been a great resource for algae ID and she typically asks me what I think the algae is based on characteristics rather than telling me what the algae is under the scope. Some characteristics that are important for filamentous algae ID include cortication around the cells and pericentral cells.

Algae sorting!

So far, we have completed our spring survey at 10 dive sites, that range from turf reefs in the south to lush kelp forests in the north. For the following few weeks, I will assist the lab with some molecular work, learn about the process of preparing DNA samples for sequencing, and then prepare for the late summer round of diving. I am eager to share with everyone what I learn in the lab!

Share