As mentioned in my prior blog, the month of June was busy with diving as we completed our spring survey at 10 dive sites. A break from intensive field sampling presented the opportunity to do molecular work in the lab! I was excited to dive into preparing environmental DNA (eDNA) samples for sequencing after spending several weeks collecting and filtering water destined for eDNA analysis. To reiterate, the Rasher Lab’s project in the larger Maine-eDNA program is focused on studying “Species on the Move” within kelp forest ecosystems across the Gulf of Maine (GoM). This study pairs traditional ecological surveys with collections of eDNA water samples, during our dive surveys. Combining the two approaches will help us gain a better understanding of our rapidly changing kelp forests in the GoM, because eDNA may reveal the presence of newly arriving species in the ecosystem that are currently too rare to detect through visual counts.
In our study, eDNA sampling consists of collecting six liters underwater at the dive site as well as three liters of water 1 meter below the surface. We take the water back to the lab and filter it immediately; the filter is then frozen for DNA extraction. This sample has a mixture of DNA from many organisms found in the environment, from bacteria and algae to the rarer fragments of DNA from fish, marine mammals, or sharks that may have swum through the area. Therefore, these samples contain a lot of information about the ecosystem – but finding the information you want requires a lot of lab work to ask the questions. I am going to discuss three different kinds of molecular work that we use to answer eDNA-related questions.
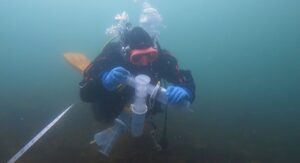
Me collecting water along the transect for eDNA analysis
Using eDNA to measure fish diversity
One goal of the study is to ask what fish species live in the rocky reef ecosystems along the coast of Maine. For example, how do fish communities in the GoM differ between those found in colder, northerly kelp forests vs. those found on warmer, southerly reefs? We start to answer this question by completing visual fish surveys, where we swim along transects and record the fish we have encountered. But if you have ever experienced a fish survey, you may realize it could take hundreds of hours underwater to see all the fish species. Now picture trying to do these fish surveys in a cold-water ecosystem with poor visibility, where few people have completed fish censuses before, and you’ll quickly realize that the fish surveys do not do justice to the fish diversity found in that ecosystem. So, we can ask our eDNA samples what fish are present by sequencing the fragments of fish DNA found in the water sample. To prepare the eDNA samples for sequencing, we use a process that includes PCR, PCR clean-up, gel electrophoresis, and Qubit®. The purpose of these steps is to amplify and isolate the fish DNA fragments from the eDNA sample prior to sending our samples to a company that conducts DNA metabarcoding, which will provide us with information of what species of fish are present in the environment.
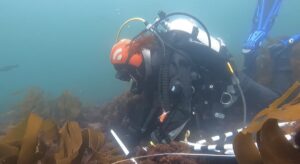
Dara Yiu completing a juvenile fish swath survey at Metinic Island, midcoast Maine
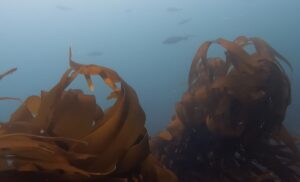
An example of poor visibility: a school of Pollock at Metinic Island seen only four meters away
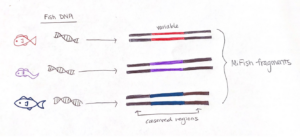
To effectively sequence the fish DNA, we need to choose a genetic “barcode”, which is a DNA marker where the associated gene sequence is unique for each species. A good barcode has two conserved regions that “sandwich” a variable section. The conserved regions are shared among all fishes, but not bivalves or crustaceans, and the variable region contains information to identify fish species. The sequence we target is called the “MiFish” fragment, and it fits the criteria extraordinarily well such that it has been used to assess fish diversity around the world.
We start preparing our sample for analysis by setting up a chemical reaction that easily finds the fish DNA fragments and makes thousands of copies. This process is called a Polymerase Chain Reaction (PCR), which is the molecular tool we use to amplify the fish fragments in our eDNA sample. PCR has three main steps: denaturing, annealing, and extension. But prior to starting those steps, we use a MiFish gene primer set to maximize the detection of fish DNA fragments. Essentially, this primer set detects the conserved region of the MiFish sequence in the eDNA sample and “latches on” to the respective section of fish DNA. In the end, it is easier to sequence and differentiate thousands of copies of the fish DNA, so amplification is an important step in measuring fish diversity from eDNA.
To set up this PCR reaction, first, I make a “Master Mix” which contains the following ingredients: primers that bind to the “conserved” sections of the barcode region, free nucleotides which are building blocks of DNA, and Taq polymerase – the enzyme that puts the blocks together and makes the new DNA strand. The amount of Master Mix created for each PCR is dependent on the number of samples that will be processed, and luckily a pre-programmed Excel sheet calculates the numbers! The Master Mix is then aliquoted into PCR tube strips and the eDNA sample is added too! All the PCR samples are then transferred to a thermocycler aka “Larry”.
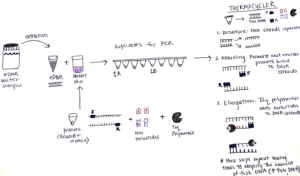
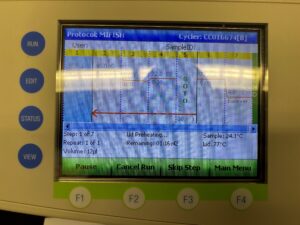
The thermocycler is programmed with an optimized temperature cycle for the replication of our fish DNA. First, the samples are heated which causes the DNA strands to separate. Next, the samples are cooled in an annealing process which allows the primers to bind to the DNA strands. Lastly, Taq polymerase extends new DNA strands by adding the free nucleotides (building blocks) after the primer sites, making copies of the MiFish fragments. These three steps are repeated many times which results in amplification of the fish DNA. So, the small amount of fish DNA that was in the original sample ends up being a much larger amount after PCR.
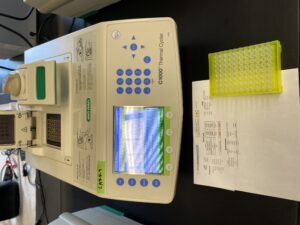
“Larry” the thermocycler
Once our samples come out of the thermocycler, the PCR is complete, and we must run a gel electrophoresis. Electrophoresis uses electrical charges to separate DNA fragments of different lengths. Because DNA is negatively charged, the positive charge on the bottom of the rig pulls the DNA towards it, and over time the smaller DNA fragments travel faster and farther through the gel. This results in the band formation of DNA in the gel. The purpose of gel electrophoresis is to visually determine if the sample contains fish DNA. I combine a small portion of DNA with a loading dye. This is repeated for all the samples. The first and last wells of the gel are loaded with a DNA ladder which provides a reference for DNA fragment sizes. Once everything is loaded into the wells, I attach the lid and turn on the machine which sends electrical charges through the gel.
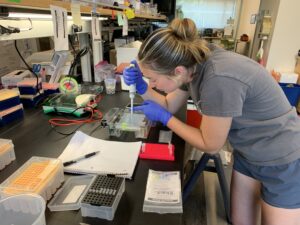
Loading a gel!
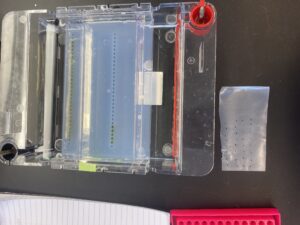
What a gel looks like as it is being loaded!
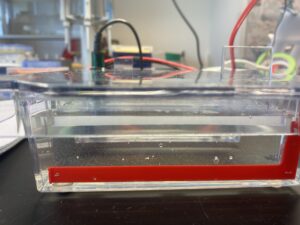
The bubbles in the gel rig form when the gel is running!
After the gel is run, the bands created during this process need to be dyed again and we use a DNA stain called SYBR gold. The gel is placed in a Tupperware container in the dark as SYBR is light-sensitive, for an hour to “soak in” the dye for UV visualization.
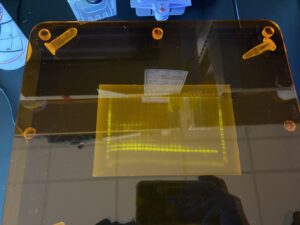
Bands from the gel!
As you can see, there are multiple bands present on the gel, but consistently the bottom bands represent our fish DNA. We want our final sequenced samples to be as “clean” as possible, so the remaining fish DNA post-PCR is given to Dara Yiu, a PhD student leading this part of the project. She completes a clean-up process which aims to remove excess fragments that may have also been amplified by the MiFish primers. This is because the MiFish primer can also attach to some bacteria that may share similar DNA segments to fish. We run one more gel, and then the samples are almost ready to be sent for sequencing!
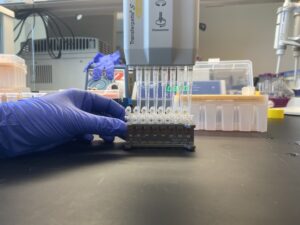
Clean-up process!
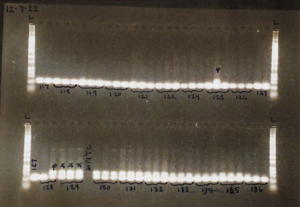
Example of a finalized gel!
The last step before sending in the fish DNA for sequencing is to place them in a Qubit®. The Qubit® quantifies the amount (concentration [ng/uL]) of DNA in the whole sample based on a fluorescence emission. For example, the fluorescent dyes will emit a signal to the machine if it has bound to the target molecule, which in our case, is the DNA found in the sample. Because the Qubit® reads the DNA concentration of the whole sample, not just the fish DNA, the clean-up process is an important step.
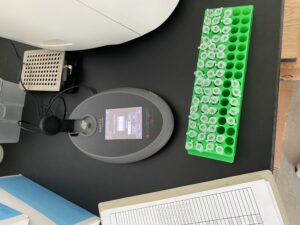
Qubit® and samples
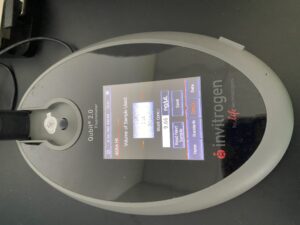
Close-up of Qubit® screen
Now the DNA samples are ready to be sequenced! We send them to a facility for DNA metabarcoding, which means the samples will be put into a sequencing machine that will read each DNA fragment. We will then match our sequences to a reference library (i.e., a database that contains the unique genetic signatures of each species that may be present in the GoM) to identify the fish species found at the rocky reefs where we collected our eDNA water samples.
Using eDNA to detect and quantify invasive species
After concluding fish molecular work with Dara, I learned two other variations of PCR: quantitative (qPCR) and droplet digital (ddPCR). These methods are typically used to identify a single species found in an eDNA sample and quantify the number of gene copes that are related to that species. Shane uses these methods to detect the presence of Dasysiphonia japonica (DJ), which is an invasive filamentous turf-forming red algae found in the southern Gulf of Maine, where kelp forests have largely collapsed in recent time.
When DJ is well established in an ecosystem, it is easy to see. It creates a fluffy red carpet on the bottom, where it may outcompete other native algae species, like kelp, for space. As the GoM gets warmer, DJ appears to be rapidly moving north up the coast. DJ can spread quickly because it can reproduce when it branches fragment or when its spores are transported in the water column to a new location. By subjecting the eDNA samples to qPCR/ddPCR we can measure the precise amount of DJ DNA in our eDNA samples, to verify its presence and infer how much DJ is present in the environment. Due to the sensitivity of these methods, we may be able to detect the presence of DJ on these reefs before we see it on our SCUBA surveys.
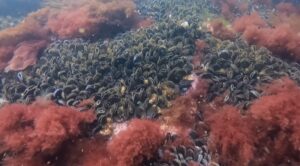
One example of kelp loss in a southern Maine rocky reef ecosystem and as a result DJ turfs form carpets
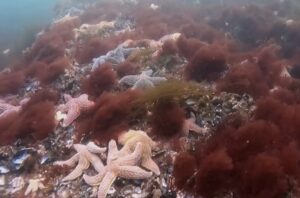
Another example of examples of DJ turf formation
qPCR is a similar PCR process that replicates a targeted sequence of DNA; however, it is special because when the target sequence is present, it gives off fluorescence as the reaction amplifies the DNA. By measuring the fluorescence and relating it back to standards of known gene copies we can calculate how many strands of DNA were in the original sample. qPCR assays need to be designed so only the target species is amplified thus giving off fluorescence. In our case, I had to confirm that the qPCR would only amplify DJ DNA and not accidentally amplify other common red algae species found at our GoM rocky reef sites. To test this, I first extracted the DNA from four red algae: Polysiphonia, Euthora, Palmaria, and an unknown red tube alga. Next, we ran a qPCR with those samples using the DJ assay. Luckily, none of these species amplified during qPCR, so we have a good molecular tool to measure DJ DNA.
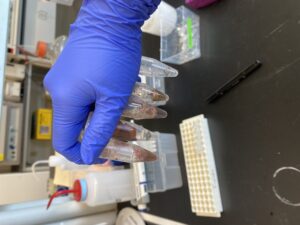
Crushed up algae for DNA extraction!
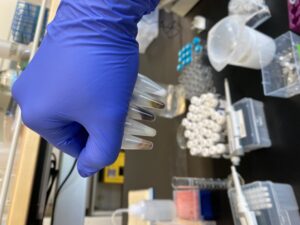
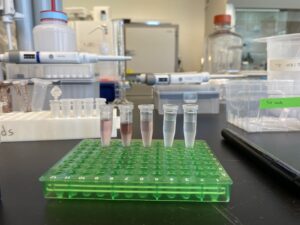
Once we confirmed the specificity of the qPCR assay to only target DJ, we will be able to use it as a tool to determine how much is present in the water at different rocky reef sites.
After I learned how to use qPCR, I was presented with the opportunity to learn droplet digital PCR (ddPCR); which is like qPCR in that they both target single species, but ddPCR is newer and has a higher sensitivity – in other words, it can detect lower quantities – therefore greater capabilities of tracing rare species occurrences. Because of the high sensitivity, ddPCR is most used in the medical field, for example with cancer research. ddPCR gets its name “droplet” because there are 20,000 nano droplets in each tube, so rather one tube containing a single reaction, each tube contains 20,000 nano reactions. This is what contributes to its higher sensitivity. These droplets will fluoresce (positive) when the target species DNA is present or will not fluoresce (negative) when the target is absent. These droplets represent how many copies of the target are present in a sample. With our goal of detecting potentially rare invasive species and their range shifts across the coast of Maine, we decided to use ddPCR because of its higher sensitivity over qPCR.
To effectively use ddPCR, Shane Farrell (a PhD student leading this part of the project) and I have been running a series of tests to determine analytically validate the precise sensitivity of the DJ assay. First, we needed to optimize the temperature the reaction is run at; this meant exposing the same sample to a temperature gradient in a thermocycler. This test produced a series of separations between positive and negative droplets. The temperature that produced the most separation between positive and negative droplets, with the least amount of “noise”, is the optimal temperature to run the ddPCR for the future assays. However, if the temperature is too low, the assay would not be as specific, so we chose 59.5 C as opposed to 57 C. The additional 2.5 C adds to the specificity of the assay. We also completed two other tests to understand the false positivity rate of our assay and determined the lowest amount of DNA we can accurately quantify in a sample.
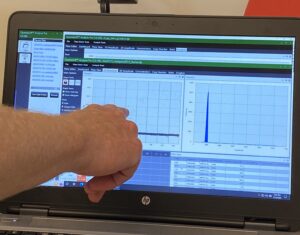
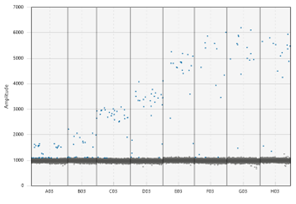
The dots on the upper portion of the graph represent positive droplets, whereas the line of dots on along the bottom are negative. We chose the temperature being pointed to, as there were the least number of dots in-between + and –
After completing these tests that help us understand the limitations of our ddPCR assay, we will run 110 eDNA samples with the ddPCR to find out how much DJ is present at our study sites distributed across the GoM. We already know that DJ is abundant in the southern waters, but it is important to document the spread up the coast to the cold northern waters, where kelp is currently still abundant. Afterall, the Rasher lab is focused on “Species on the Move”. We will also be using ddPCR to track two other species whose ranges are shifting: Membranipora membranacea (lacy bryozoan) and Centropristis striata (black sea bass). Developing a solid understanding of ddPCR as a molecular tool will be beneficial to recognize the range shifts of species as they react to warming in the GoM.
I am super thankful for the numerous opportunities I have had to conduct molecular work with Dara and Shane. It is truly a unique experience to be part of projects in the upcoming world of eDNA, especially on work being completed in my home state. As the end of my internship approaches, I am excited to be part of the summer sampling season at the 10 dive sites as well as finishing the remaining fish surveys!

